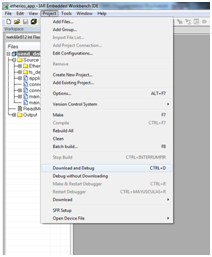
To download and debug, you can also use the icon or use the Ctrl + D keyboard shortcut.
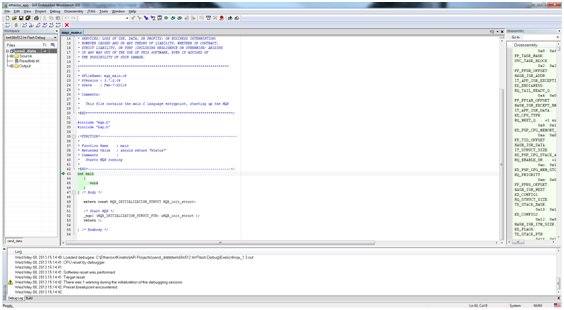
While the download takes place, the IAR will automatically switch to the Debug perspective. Once the download is complete, you will see a screen similar to the following:
Debug in the same manner as any other IAR project: insert breakpoints, watch variables and everything that the IDE offers to you. Consult the IAR Embedded Workbench IDE Help to learn more about using debugging features.